


Instruction | Science
Science | Instruction
Catenary Curves: Scientific Experimentation
Instruction
Students will design and conduct an experiment about catenary curves and their structural qualities. Using Dulles International Airport as a case study, students will investigate how catenary curves are important to the structure of the building. (A catenary curve is the shape that is formed when a cable, string, or other flexible strand is suspended from two points.)
- Activity 1: Dulles International Airport
- Activity 2: Materials Investigation – Select One
- Activity 2a: Drawings: Requires pencils, paper (large preferred), string (at least two types preferred), and paper clips. A camera is recommended.
- Activity 2b: Models: Requires pencils, string, cardboard, tape, school or all-purpose glue, and water – plus space to store projects while drying.
- Activity 3: Experiment Report
- Assessment
Activity 1: Dulles International Airport

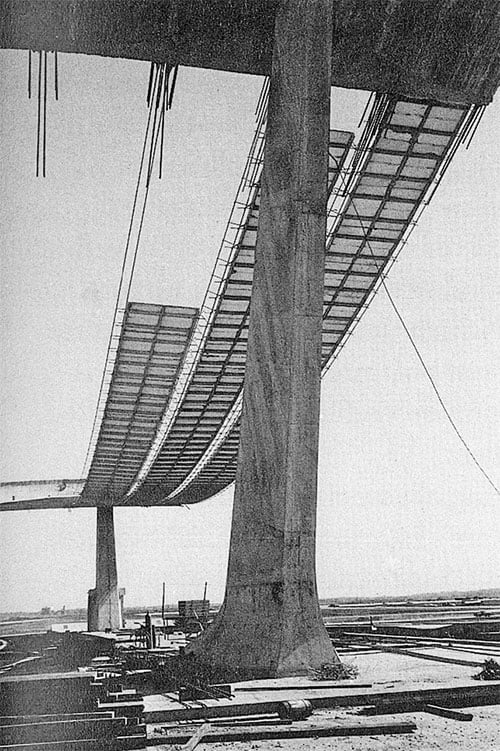
PHOTO 1: Dulles International Airport under construction showing precast concrete panels being attached to cables hanging in a catenary curve.
- Review or introduce scientific investigation principles as appropriate for your students.
- Introduce the assignment to students, explaining that they will be designing and conducting a scientific experiment based on the Dulles International Airport roof design.
- Watch the Dulles International Airport segment from the PBS special, 10 Buildings that Changed America, on DVD or at wttw.com/10buildings. Prompt students to take notes during the segment, paying particular attention to the roof design and to scientific inquiry. CONTENT NOTE: In this segment, Reed Kroloff says, “Damn right.”
- Facilitate a brief discussion about what the architect investigated before designing the airport. Questions to prompt discussion may include:
- What questions did the architect ask about how people used existing airports?
- How did he acquire his information? What else could he have done?
- What did he find out? What other information could be sought?
- How did this inform the design of Dulles International Airport?
- Introduce the assignment in greater depth. Explain that using scientific inquiry, students will hypothesize and test catenary curves, explaining what a catenary curve is and that it is the shape of the roof at Dulles International Airport. (A catenary curve is the shape that is formed when a cable, string, or other flexible strand is suspended from two points.) The roof was constructed by attaching precast panels to cables that had been hung in a catenary curve (See PHOTO 1). To explain this in terms that may be more understandable to students, use an analogy of a rope bridge with a walkway of wooden planks. The ropes are analogous to the cables at Dulles, the planks to the precast concrete panels.
- Facilitate student discussion about catenary curves and the materials used to construct the roof of Dulles International Airport, so students are able to:
- Understand how a catenary curve is formed.
- Understand how a catenary curve is used at Dulles International Airport.
- Understand the materials used to form the catenary curve at Dulles.
- Hypothesize how the Dulles roof could have looked different while still using catenary curves (e.g., longer or shorter cables would have changed the shape).
- Explain that the students will be constructing catenary curves through drawings or models (depending on teacher’s selection of Activity 2a or 2b of the Materials Investigation).
- Based on class discussion, have students create hypotheses about catenary curves to share with the class. Suggestions for hypotheses: curve shape may vary based on string type or length, and curve shape may be impacted by additional supports, additional weight, or by changing the height of one of the anchor points.
- Discuss what the variables would be for each student hypothesis. Based on this information, ask students to select hypotheses from the class list that seem testable with the selected materials investigation approach.
- Assign students to write an individual hypothesis for catenary curves, list of variables, and how they will test it. Enter this information in the first section of the worksheet “Science Worksheet” which should be used throughout the project.
Activity 2: Materials Investigation – Select One
Activity 2a: Materials Investigation through Drawings
2a Materials List:
- String (at least two types)
- Pushpins and/or tape
- Paper clips
- Paper (preferably large)
- Pencils
- Camera (optional)
2a Instruction:
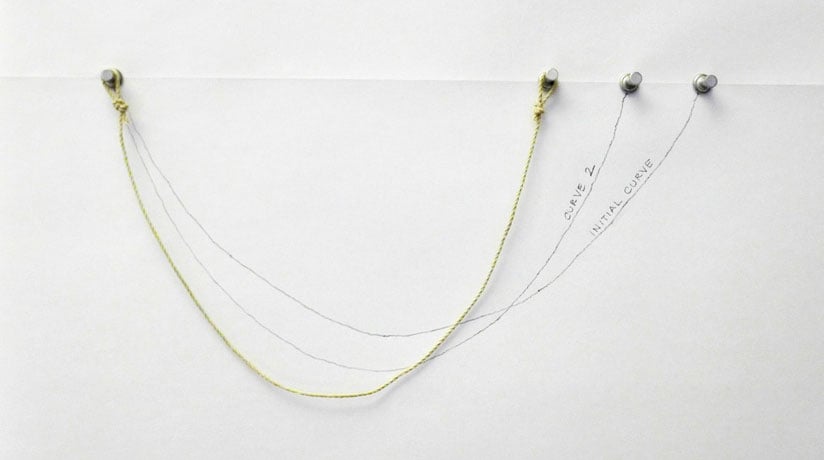
PHOTO 2: Variations in catenary curve shapes using push pins and string. (Click for larger)
- Teachers will demonstrate the following instructions before asking students to attempt individually or in pairs.
- Use two pushpins to hang a large piece of paper at the upper corners. Make sure pushpins are approximately level with one another (i.e., the same height from the floor). Tape can be used as an alternate to pushpins.
- With a lightweight string, approximately two feet long, tie a small loop at each end and hang one loop over each push pin. Ensure that when the string is hanging, it is entirely on the paper. Shorten the string, if necessary.
- Carefully trace the resulting catenary curve onto the paper (See PHOTO 2). Note on drawing that this is their initial curve.
- Once all students have their initial catenary curve drawn on their paper, let them begin their scientific investigations. Suggested investigations include:

PHOTO 3: Testing how weight from paper clips changes the shape of a catenary curve. (Click for larger view.)
- Testing varied lengths of string to see how the shape of the catenary curves changes.
- Testing varied types of string to see how the shape of the catenary curves changes.
- Testing how weight (e.g., paper clips) could be added to the string to see how the shape of the catenary curves changes (See PHOTO 3). Can the original curve be maintained? How is this achieved (i.e., what spacing and how many points approximate the curve)? Does this hold for varied lengths/string types?
- Testing how changing the location of one endpoint changes the shape of the catenary curve.
- 6. For each variation, students should document the resulting shape of the string on the paper and note which variables were modified. Note: another option is to document each result separately with a camera, permitting the images to be compiled digitally. Document this in the second section of the worksheet titled “Science Worksheet,” which should be used throughout the project.
Activity 2b: Materials Investigation through Models
2b Materials List:
- Cardboard (recommended: each student or group should have one piece of cardboard that ranges in size from 6 to 10 inches square)
- String
- Scissors
- Tape
- Water
- School or All-Purpose Glue
- Hair Dryers (optional)
2b Instruction:
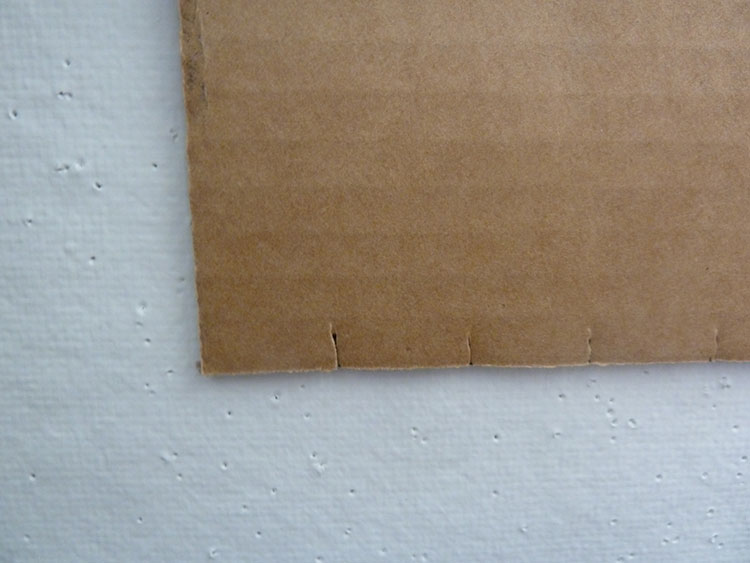
PHOTO 4: Cardboard base with slits. (Click for larger view.)

PHOTO 5: Attaching strings to cardboard base with tape. (Click for larger view.)
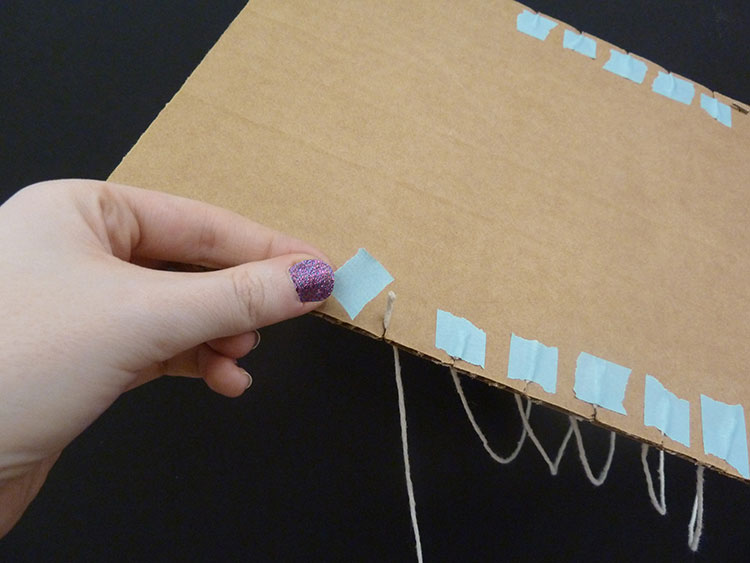
PHOTO 6: Attaching strings to cardboard base with tape. (Click for larger view.)
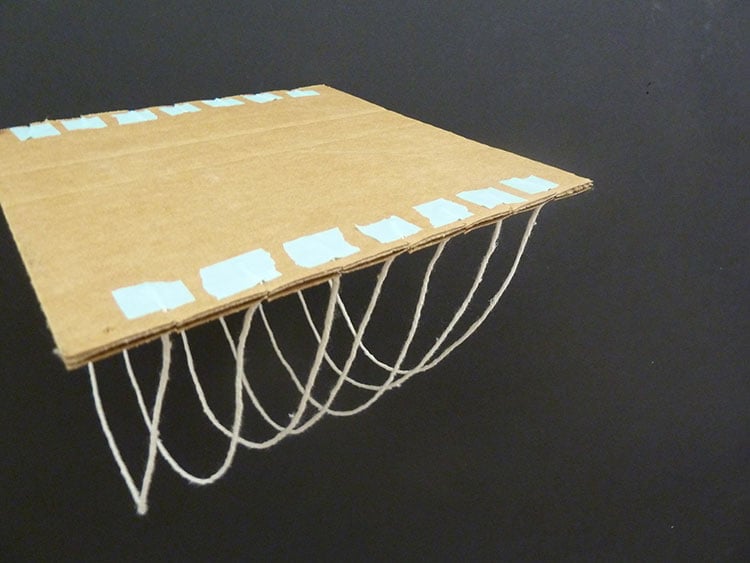
PHOTO 7: Cardboard base flipped over to verify catenary curve shape of strings. (Click for larger view.)
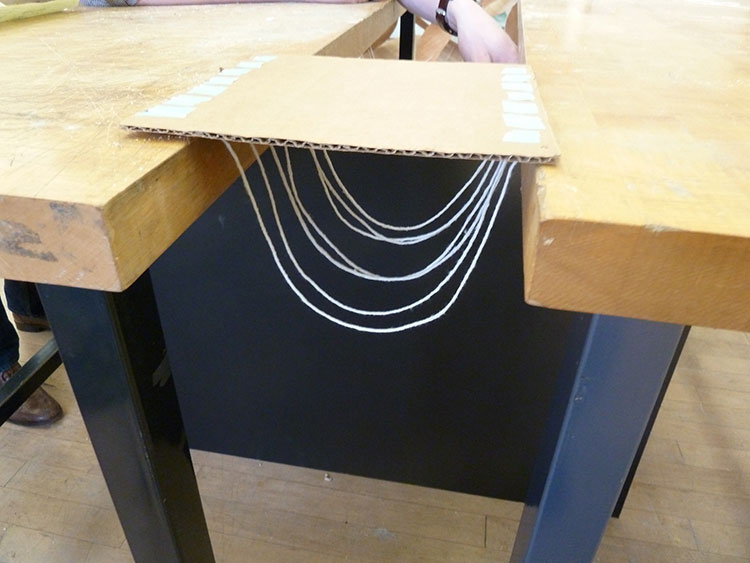
PHOTO 8: Model set between desks in preparation for glue application. (Click for larger view.)

PHOTO 9: Final model after glue has dried. (Click for larger view.)
- Teachers will demonstrate the following instructions before asking students to attempt. Access to a sink is helpful for the glue and water necessary in this project. If the classroom does not have one, teachers may want to provide hand wipes or a bucket of soapy water for hand washing. The workstations may get messy from the glue; consider covering tables/desks with paper before using glue.
- Create small groups of three to four students. Student groups should discuss what they want to investigate as a group. The group will test a hypothesis by each student creating different models demonstrating different values for the variable(s) critical to the hypothesis. Document this in the second section of the worksheet titled “Science Worksheet,” which should be used throughout the project.
- To construct the models:
- Attach ends of string to cardboard base; multiple strings will be needed. For a linear design like Dulles International Airport, create small slits (approximately 1/4 inch) evenly spaced on two opposite sides of the cardboard base (See PHOTO 4). [jump link to PHOTO 4] Slide string into slits and tape onto back of cardboard (See PHOTOS 5 & 6). For a radial design like a dome, draw a circle on the cardboard base. Tape ends of string on opposite sides (180 degrees apart) of the circle.
- Verify resulting catenary curve by flipping the cardboard upside down so the strings hang toward the ground (See PHOTO 7). Curves can be modified by rearranging strings.
- When strings are complete, find a location where each model can rest upside down with strings hanging in a catenary curve. Models can be set between desks by creating a small gap between the desks (See PHOTO 8) or yardsticks can be slid through the more open projects and set between desks.
- Use hands to coat the strings with watered-down school or all-purpose glue. The mixture should be approximately 30% water and 70% glue.
- Let glue dry overnight or use hair dryer to quicken the drying process. Once the strings are completely dry, the cardboard is ready to be flipped over (See PHOTO 9). Drying time will vary by project.
- Have the entire class place their models together, so the class can see all of the different models made. Students can discuss what differences they see. Why are some more successful than others? What variables are different that may have led to a difference in the final product? Tie this discussion back into the topics of scientific inquiry and investigation.
Activity 3: Experiment Report
- The experiment report (“Science Worksheet”) should be a documentation of the process and should be started during the first two activities. Encourage students to revise their writing of the first two activities to make their report more clear, concise, and thorough.
- Individually, have students complete the Experiment Report using the worksheet titled Science Worksheet. It is recommended that the Experiment be reviewed after each activity.
Assessment
Assignments are designed to address the standards and learning goals of the lesson. Each assignment is mapped to the appropriate standards and learning goals.
- Evaluate the drawings/models for a systematic approach to the hypothesis.
- Level III Standard 12.5: Understands why only one variable can be manipulated at a time and that all other variables must be controlled during the investigation.
- Level IV Standard 12.3: Evaluates the results of scientific investigations, experiments, observations, theoretical and mathematical models, and explanations proposed by other scientists.
- Evaluate the Experiment Report for understanding of scientific investigation.
- Level III Standard 12.3: Designs and conducts a scientific investigation.
- Level III Standard 12.4: Identifies variables (independent, dependent, control) in a scientific investigation.
- Level III Standard 12.5: Understands why only one variable can be manipulated at a time and that all other variables must be controlled during the investigation.
- Level III Standard 12.6: Uses appropriate tools and techniques to gather, analyze, and interpret scientific data.
- Level III Standard 12.8: Evaluates the results of scientific investigation, experiments, observations, theoretical and mathematical models, and explanations proposed by other scientists.
- Level IV Standard 12.2: Designs and conducts a scientific investigation.
- Level III Standard 9: Knows possible outcomes of scientific investigation.
- Level IV Standard 2: Designs and conducts a scientific investigation.
- Level IV Standard 3: Evaluates the results of scientific investigation, experiments, observations, theoretical and mathematical models, and explanations proposed by other scientists.
- Level IV Standard 5: Knows that conceptual principles and knowledge guide scientific inquiries; historical and current scientific knowledge influence the design and interpretation of investigations and the evaluation of proposed explanations made by other scientists.